Song Placement Analysis
11 May 2020 -
In my ultimate goal to create a model that can predict if a song is the last song in a set or not, I’m looking at the number of songs played so far, the song being played, and the amount of time passed in the set so far. I already did some work on number of songs played in a set over Phish’s career and today I looked into the way that songs are placed within sets and complete shows.
Equate My Life with Sand
Set 2
I had to take several steps to get numbers that I needed. I started with the table in the last project where it shows every show and how many songs are in each set and was able to create a table that has every track from every show and then shows the following:
- How far into the show it was played.
- The position of the song within its set.
- Then a true or false for if it is a set opener, a set precloser (song before the closer), a set closer, and then repeats the same three for set 1, set 2, set 3, and encore specifically.
This allowed me to create tables that show for each song the percentage of times it opened a set, was the second song in a set, was the second to last song in a set and closed a set. I also created a table that showed the average placement of a song and the standard deviation of the song placement. This allowed me to see which songs tend to be at the beginning or end of shows and which songs tend to hover around the same placement in a show as opposed to showing up all over a show. From this I chose five songs to make some beeswarm diagrams so you could see how song placements are distributed visually. In that section, I adjusted song placement to be by set instead of overall show.
In the last step above, I realized that I hadn’t adjusted for shows that had soundcheck tracks. For the phish.in website, they need to have a position to be shown first, but I didn’t want soundcheck songs to count as part of the show and forgetting that made it so my formulas were off. Unfortunately, the adjustment I made to my SQL query wouldn’t accomplish what I wanted, so I ended up dropping the 37 shows that had soundcheck tracks included.
Mystified and Mishapen
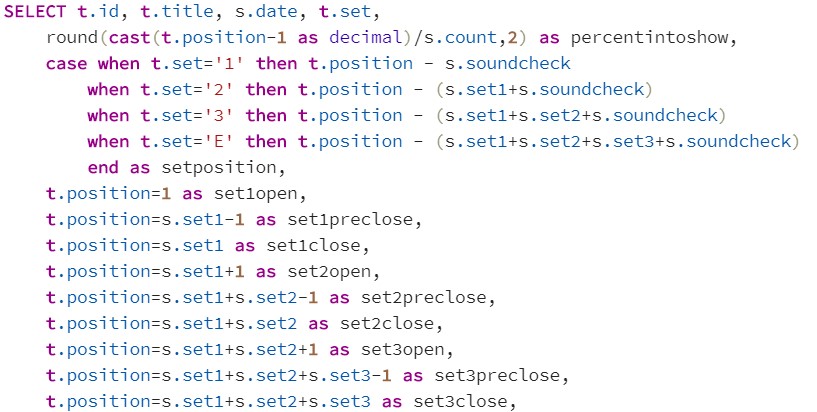
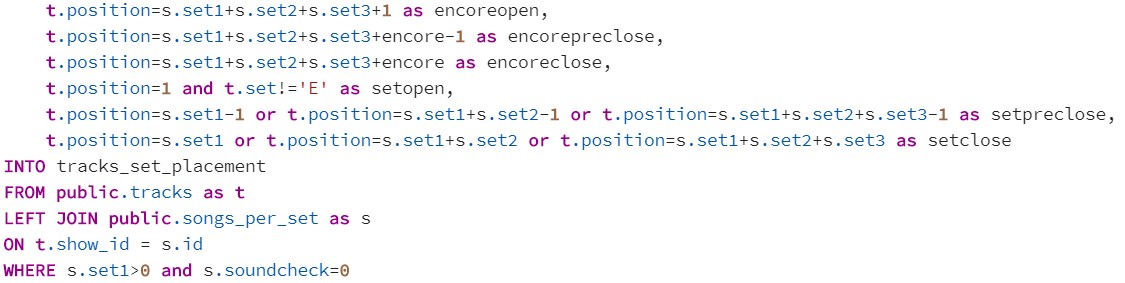
SQL Code for adding show placement, set position, and true/false for all open/preclose/close spots
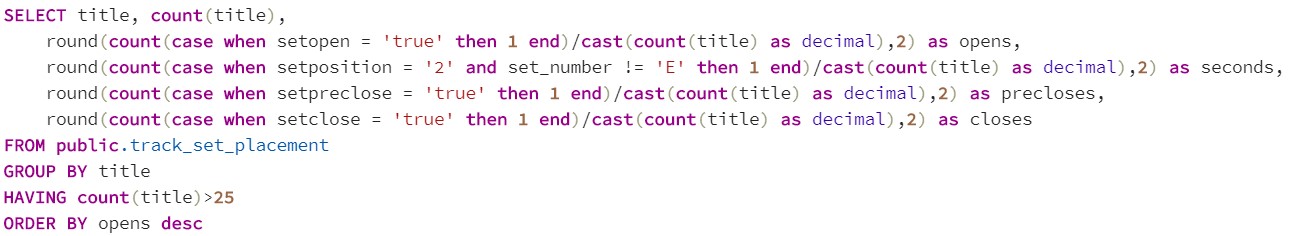
SQL Code for finding the percentage of times each song was in each set slot
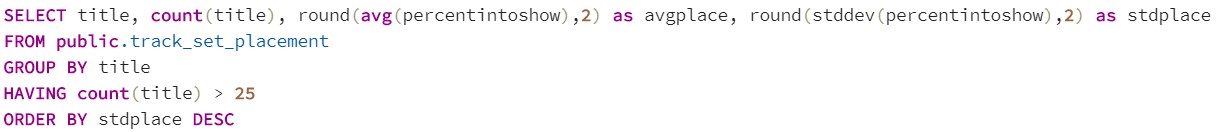
SQL Code for finding the average and standard deviation of placement
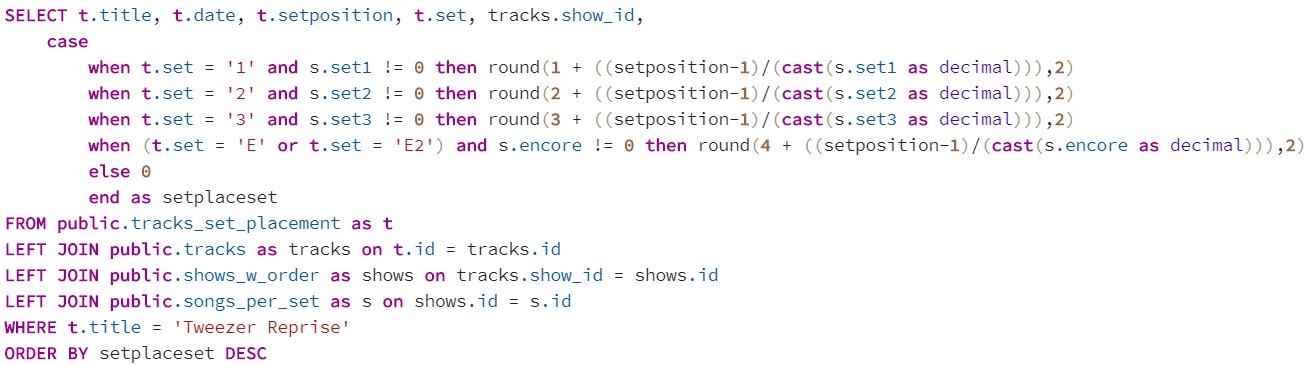
SQL Code for listing all placement for individual songs for the the beeswarm plots
And You Step to the Line
Most Likely to:
| Rank | Open a Set | Second Song | Second to Last | Closer | Middle Songs |
|---|---|---|---|---|---|
| 1 | Buried Alive (44%) | No Men in No Man’s Land (34%) | The Ballad of Curtis Loew (38%) | Walls of the Cave (73%) | The Horse (97%) |
| 2 | Runaway Jim (24%) | Foam (33%) | Harry Hood (31%) | Run Like an Antelope (61%) | Big Ball Jam (94%) |
| 3 | Party Time (23%) | The Moma Dance (32%) | Wading in the Velvet Set (31%) | Character Zero (54%) | Narration (92%) |
| 4 | AC/DC Bag (22%) | Blaze On (29%) | Sanity (29%) | Slave to the Traffic Light (46%) | Yarmouth Road (92%) |
| 5 | Llama (21%) | The Curtain (26%) | I Didn’t Know (28%) | David Bowie (43%) | Axilla (Part II) (91%) |
- Middle Songs - Song 3 or after but not second to last or a closer
- Being the first song in an encore doesn’t count as being an opener
Early and Late Songs
| Rank | Earliest Average Placement | Latest Average Placement |
|---|---|---|
| 1 | Foam (.19) | Show Of Life (0.88) |
| 2 | Kill Devil Falls (.20) | Tweezer Reprise (0.87) |
| 3 | The Moma Dance (.20) | Highway to Hell (0.86) |
| 4 | Dogs Stole Things (.20) | Sleeping Monkey (0.86) |
| 5 | Buried Alive (.21) | Good Times Bad Times (0.82) |
High and Low Variation Songs
| Rank | Least Variation in Set Placement | Most Variation in Set Placement |
|---|---|---|
| 1 | Cold As Ice (0.06) | First Tube (0.38) |
| 2 | Show of Life (0.07) | Carolina (0.35) |
| 3 | Big Ball Jam (0.08) | Alumni Blues > Letter to Jimmy Page > Alumni Blues (0.34) |
| 4 | Golden Age (0.08) | Banter (0.32) |
| 5 | Yarmouth Road (0.10) | Golgi Apparatus (0.32) |
Some Visuals
*Beeswarm songs chosen to show a variety with 100+ plays. YEM - Most Played, Foam - Early Song, Tweeprise - Late Song, Light - Low Variation, First Tube - High Variation
Setlist Notebook:
And here’s a link to my google spreadsheet with all the raw data if you want to use it for anything.